Before introducing this new resource, let me explain why we have built it.
If you follow our blog, you will know that we are trying to build a passive income system, but in our last entry, we analyze how awful our last month was. We went from a little bit more than 1 bitcoin to almost half of it, so we decide to stop the account until we figure out what to do next.
To figure out what to do next, we went to the provider section to analyze the provider through the provider stats, choosing one randomly; we went to the performance stats. There we had interesting data, but it’s challenging to extract insight from there, and you can’t compare it with another provider.
We have built a new view in the Analytics section, there is a new Providers tab, where you have much information about the providers, group by time, coin, being easy to compare and get insight from there.
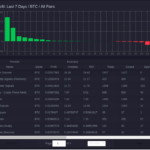
The first thing we do is selecting the period, then the coin and we’ll have the charts and table sorted by total profits percentage. In the table, we can sort by any column or any direction.
The table shows basic information, as total profit, total signals sent, how many positions from this signals, the win rate from the positions, how many are closed, the average closing time, how many of them have sold by signal, take profit, stop loss.
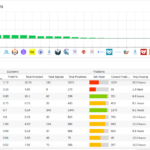
You can use this basic information, for example, if you like the win rate, you can sort by win rate and choose a provider with a high scoring here. The win rate is an excellent example because as you can see, there are situations where even with a fantastic win rate (80%), the profit is still negative. It usually happens because risk management isn’t right, and you are losing more than earning.
We can add more information like the maximum profit, minimum profit (maximum losses). This column is useful to continue investigating the win rate column. We can see that the minimum profit (the lower profitable position), is 3 or 4 times bigger than the maximum profit (the maximum profitable position). We need to balance this to make our system profitable.
Other interesting information is the data from the average position size. It’s interesting because you will be able to know if the provider works better with small position’s size, or big positions size. We also can add the maximum position size column (or minimum), to see what was the bigger position size — getting insight if the provider is right or not for big or small positions size.
More data is the interval, how the price worked for a given group of signals. For example, the higher price, the lower price before the higher price, and when the higher price is usually reached. With this data we can go to the provider settings, place a buy price deviation close to the lower price, the buy order expiration close to the time elapse before reaching the higher price and also you could include take profit targets based on the higher price usually reached and your buy price deviation configuration.
Columns are remembered in your browser, so if you go back, forward. Your columns will be there when you are back.
The last thing, at the bottom of the view, you will find a link to the columns’ documentation.